On The Shoulders of Giants

This may be a revelation to some… there is nothing new in the toolsets of continuous improvement (TPS, OpEx, Lean, Six Sigma, Agile or whatever you want to call it). The newest tools have their derivation at least two decades prior to anyone giving the current labels. There are three really valuable aspects of current approaches:

  1. A logical roadmap for the application of the tools
  2. All of the really bright people out there trying to advance the practice of change management
  3. Organizations that understand Constancy of Purpose, at least for a few years at a time. I will tell you some stories about the current practitioners. First I want to ground us in the real pioneers that led us to this point. I am certain that each of the people I will mention here had a similar group of mentors. My journey began in the early 70’s and I can only tell the story from there.

I believe I am putting these in chronological order of their impact on my development. My personal giants and why:

Dr. Lee Weaver – Lee is probably the best professor I ever met and he instilled in me a passion for statistics, specifically applied to Quality and Reliability. Lee also worked for Honeywell and so, from the beginning, I was taught the practical side of what were typically very theoretical subjects.

Bill Mitchell – A Scottish gentleman (and I mean that in the finest sense of the word) who NCR had the foresight to make my boss very early in my career. Bill was the first boss I knew who believed his job was to coach and mentor. He taught me that all these decisions we make with increasingly complex toolsets had to be, first and foremost, sound business decisions. He also taught me about truly supporting your people. He said to me the day I went to work for him –

“I will always support you publicly no matter what you do. If I believe you have done something wrong, I will call you behind closed doors and discuss it with you. I will listen to your perspective; you will listen to mine and we will decide what to do. We will both own the decision and never walk out of my office saying that we are doing anything other than what we think is right. Anything else will weaken both of us.”

I can tell you that Bill was the best boss and mentor I ever had and he lived up to his words. I have honestly tried to structure the same relationship with all of my bosses and with all that I have influenced since that day. I can tell you that Bill’s methods caused him considerable pain because I certainly tested the limits. I can also tell you that I have experienced considerable pain because I support people in the same way. Nonetheless, I grew and learned under Bill’s wing and I have seen hundreds of people really blossom and grow when allowed to have freedom to do their job. I wouldn’t have it any other way.

Bill also gave me the job of defining the Quality System at a point in time when I did not have a clue what that meant. It was the greatest gift I ever received because now I understand that all of the wonderful “silver bullets” that are sold today have to logically fit into a system or they have no long-term value. Remember that the “silver bullets” are not the system. Also remember that being judged to have an adequate system by ISO or a customer doesn’t mean you actually have a good system – what you do has to make sense and flow.

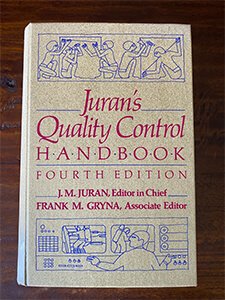
Joseph Juran – I was first exposed to Juran in two ways. I inherited a copy of his Quality Control Handbook early in my career and had the opportunity to lead a group going through “Juran on Quality Improvement”, a videotape series meant to teach people a structured approach to problem solving. I got a copy of Juran’s Managerial Breakthrough as part of that. That book is the basis of what is now known as Lean and Six Sigma. I learned two significant lessons from the book: 1) all change happens project by project and 2) breakthrough has to be approached by first taking the time to understand the underlying process (the ‘journey from symptom to cause’ to quote Juran) before ever trying to solve the problem. Juran’s thoughts on the Quality System expressed in his Trilogy are right. I can still pass ASQ’s CQE, CRE, or CSSBB exam with Juran’s Handbook as my only reference.  I had the chance to meet him twice – he was gracious and generous with his time on both occasions.

Bob Galvin – Bob is the son of the founder of Motorola and was CEO of Motorola when I joined them in 1983. Bob brought participative management (PMP) to Motorola a few years before I joined and began a serious push toward improving quality the year before I joined. I will tell you that Motorola was the most exciting place I ever worked and that for the eight years I worked there, I learned something new every day. I attribute to Bob the opportunity to learn and be excited about my job. Participative Management made us understand differences in people and to respect everyone in the organization. The push for improved quality forced us to find useable tools. It was not acceptable NOT to have real improvement on a daily, weekly, monthly basis. It WAS acceptable to try new things, but fail, at Motorola. We were just expected to learn from these failures!

Bob also introduced Cycle Time Reduction (what we called Lean before Womack) in 1985 and, although it is not publicized, time was the real catalyst that made all of the quality improvement tools real. Go look at the corporate metrics from 1986 forward and you will find that time reduction was right there, equal to defect reduction. In simple terms, we found we could reduce defects without impacting the basic flow (read that as real cost), but we could not truly impact flow without addressing defects. So by linking time and defects, we found the defect reduction tools useful and also discovered their impact to the bottom line.

Bob changed the measurement system, which gave people who truly believed in this an umbrella under which to operate with complete freedom. I believe Bob will be recognized over time as the greatest corporate champion of all time (sorry Jack Welch, but I knew someone greater than you). Bob is also the model for training the workforce. Motorola had required a minimum of 40 hours per employee per year (that is all employees, not just some). Several of my eight years, I had more than 300 hours.

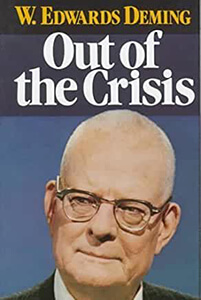
W. Edwards Deming– The only thing I want to tell you is that Deming was right and if you do not understand that – go read Deming. If your only takeaway is to embrace his 14 points in how you behave as a leader, your organization will improve dramatically. I have read everything Deming ever published and I think the best was Quality, Productivity, and the Competitive Position because it was pure Deming – no editing. Remember that he did not say, “Drive out training and institute fear;” he said just the opposite. Also, remember that he did not say NOT to set goals, he said don’t set goals without also providing methods and tools to achieve them.

One of his fourteen points is the most critical – Create constancy of purpose for improving products and services. TPS is probably the best long term example of this. Most companies fail in the long term whether they call it TPS, Lean, Agile, Six Sigma, … because they get new leadership who lose the Constancy – it never works out well.

I had the chance to meet Deming several times at Motorola’s expense and even had dinner with him several times. He was also gracious and generous but not the least bit impressed by labels, especially Six Sigma and Lean. He wanted to know what I was actually doing and was impressed by the work at Motorola.

John Lupienski – In my opinion, John was, and still is, one of the most influential forces on what Motorola calls Lean and Six Sigma today. For example, John and I first documented the roadmap that is used by most providers of Black Belt training back in 1988. John recognized the need for the roadmap. Those who are claiming all of the credit for the roadmap and all of the buzzwords around it did not even have it right when it was sold to AlliedSignal and GE. This point is easy to prove by researching all of the “intellectual property” sold to these two companies. John has always known the next logical step to take in this journey and has driven it regardless of the opposition he confronts. He is also a great teacher who has been sharing his knowledge with everyone involved with ASQ in the Buffalo, N.Y. area for over a quarter of a century. John remained loyal to Motorola and Buffalo even though it is clear he could have advanced his career, his fortune, and his personal notoriety by following the path taken by many of us.

Marty Rayl – Marty is simply the best champion I have ever experienced. Most who have had to deal with Marty would tell you some very unpleasant stories. If you did not cooperate with Marty’s folks at Motorola in the late 80’s, Marty would provide you with one of the most unpleasant experiences you would ever hope to avoid in corporate America. His message? Cooperate with my people or you get to deal with me! The Automotive group of Motorola made outstanding improvements during Marty’s time there. Marty also taught me to have a “book budget” – to give away books to anyone who would obligate themselves to use them. I maintain the model to this day.

Steve Zinkgraf – Steve made the consulting model work. The intellectual property sold to AlliedSignal and GE was unusable and Steve created the backbone of all the training materials that resulted from those efforts while he was an employee of AlliedSignal. My team at AlliedSignal Automotive finished out the backbone Steve created. Most of you were trained using a derivation of AlliedSignal’s intellectual property. Steve taught me to teach DOE in simple useable language. Steve’s and my work with Minitab in the late 80’s through 1998 set the stage for much of the functionality that exists in Minitab that is specifically geared toward the Continuous Improvement community.

Richard Schroeder – the only person I know superior to John Lupienski in knowing what to do and equal to Marty Rayl when it comes to supporting his people. He is unrivaled at challenging the thinking of the C-suite. Rich has had unprecedented influence in corporate America with Galvin, Bossidy, and Welch at the top of the list of persons he has affected. His influence continues today. He alone set the course for GE and AlliedSignal long after both companies tired quickly of the Mikel Harry magic act. Rich is the reason they stayed the course and therefore the reason for an amazing run of profit improvement. You can see Rich’s impact if you look at the profits and stock price of AlliedSignal (1995 – 1999), GE (1996 – 2001), Kraft Foods (2010 – 2013), and dozens of other Fortune 500 companies. Remember Deming’s constancy of purpose? That is what Rich brought in those time periods.

Jack Welch – I do not worship at the feet of Jack Welch like many do, but it has to be noted that he created the largest culture of grasping change and driving it ever seen in the history of the business world. What was called Lean and Six Sigma at GE in the late 90’s is the culmination of twenty plus years of groundwork laid by Jack and his staff. Every leader in business should hope to have a fraction of the influence Jack has had. It also should be noted that GE had the weakest Six Sigma and Lean practitioners of all the companies implementing in the late 90’s. They succeeded on the strength of the GE culture and most were mediocre when they went elsewhere. Jack brought Constancy of Purpose to GE 1980 through his retirement. The Constancy went away within days of his retirement and you can also see that in their profits and stock price – both tanked.

Are there others? Absolutely. There are brave people through this whole thing that contributed tools and leadership. For example, I would read everything Ohno and Shingo wrote. They are not the ones claiming ownership or to be creators of all this. They are just people who did some great things at the right time, and all were open to sharing their knowledge. I thought you might want to know about some of them.

Great things can be done in a few years. Basically nothing can be done for those who seek change by end of the month or end of the quarter.

If you only read one book in your career, make it Deming’s Out of the Crisis.

— Gary

Covid-19

Our heartfelt gratitude goes out to all those who have been and continue to be on the front lines during these extraordinary times – the healthcare professionals and all who maintain and sanitize their facilities and those who serve in any essential capacity (food service, etc.) in our healthcare facilities, the first responders, the workers in food supply from the farms to the grocery stores, and others in the essential supply chain functions.  

Thank you for the work that you continue to do every day, for being away from your families and for taking risks that are orders of magnitude greater than most of us who are doing what we can by just staying home. We have over used the word hero in the last few years, but our front line workers are true heroes.  

To all the rest of us, we ask that you honor our heroes by not putting our fellow humans at greater risk. Stay home.  If you must go out in public, follow the C-19 guidelines, including wearing a mask.  

When the conditions are right, GPS is ready to safely engage wherever needed to design and implement the necessary interventions across the value chain to confront the new challenges of doing business, and to help create a stronger future.

Why Consumer Goods Executives Reach Outside for Innovation Inside.

GPS Consultant - Dewan SimonBy Dewan Simon, GPS Consultant

Innovative growth opportunities are uniquely different from current business. They require a different lens to see all that is possible. Once executives see the possibilities, they need to focus their whole paradigm, skills, and metrics on new points. Focused on the right things, taking the shot takes total commitment. They see optimal results when the change truly begins with them: The language has changed to “The top is leading this initiative – not just supporting it.”

But what does that take?

Success in creating growth based on new “Innovation” again and again lies in developing a “staged approach” to taking your idea to market.

Staged Approach

The goal is to build an organizational capable of:

  • Generating ideas
  • Designing and developing winning concepts
  • Committing its strongest talent pool to execute and launch the idea

And it’s the CEO—the entire senior management team—that’s responsible for building it.

But if they’re responsible, and the goal is change from within, why do executives reach for outside experts?

Most executives know intuitively that relying on the inspired efforts of a few homegrown resources to pursue innovative growth opportunities is a recipe for stagnation.

If you do what you’ve always done, you get what you’ve always gotten.

But we believe in the project! We gave it to our best, most talented people. We’re giving it to our A-team because we believe they can achieve results.”

Executives now realize they need more than their best people to drive Innovation Initiatives to long-term success.

Often the responsibility is passed to strong performers in the core business, who are already stretched thin; or even worse, to people who have been passed over for other opportunities because they are seen as mediocre performers, but need to be given this opportunity to change that perception.

Your big bets are not the place to test your talent’s development!

No matter how great your idea, your overtaxed A-team or your available, but untested B-team both make for long odds on total success.

In-market success requires a ‘great idea’ to align with ‘flawless execution’ and a ‘well thought out and focused marketing campaign.’ Clearly, successful Innovation Initiatives demand more than a great idea and even your best people.

Smart executives have already realized this. They know that to amass support for new innovation initiatives in the face of competing core business needs, their company’s most talented mavericks must lead this sort of work.

There are two problems with this:

  • Mavericks are hard to come by. People lose their maverick spirit in a company quickly.

And even if you can find a maverick,

  • Mavericks don’t make it very long. They are easily defeated by common, basic organizational pathologies.

How?  Let’s take a look at what befalls our best and brightest:

  • Internal politics – often given responsibility but not given any real authority to challenge or drive change with their peers.
  • Competing Deliverables – core business activities; even if they are said to be 100% dedicated to the project at hand, favors are often requested from the old work environment that never truly release them.
  • Fear of failure – not willing to challenge traditional paradigms for fear of failing in the unknown. They never put both feet in new water.
  • Hackneyed thinking – limited exposure to other industries or lack of creativity in seeing how transferable learning can come from an unlikely source.
  • Competition Focused – Too busy following the current competitive trending activity to create a new market opportunity.

Your mavericks burnout before they ever even get off the ground—that is, if they ever ignite in the first place.

Consumer goods companies realize that innovation opportunities are materially different from their core business. They have

  • different economics,
  • different capital considerations,
  • different methods of capturing value,
  • different deployment plans.

So you need different people.

Executives no longer struggle with the fallacy that they have the internal capabilities to achieve “Innovation Growth”. They need outside experts.

Stay tuned for Part 2 coming soon.

Treat your Training Program as a process

Robert Ballard

By Robert Ballard

Most professionals have heard that the key to an effective training program, specifically for an Operational Excellence initiative, is “The Right People, The Right Projects”.  Although that is true there is significantly more involved in creating an effective training program than just those two components.  The key is to look at the training program in a holistic view and by treating your training program as a process.  From this point forward the term Training “Process” will be used.

We use a common brainstorming tool to identify components of the process, the 6M’s.  These would include, but not limited to:

Training Materials (Material)

  •             Trainees (Manpower)
  •             Trainers (Manpower)
  •             Environment (Mother Nature)
  •             Measures (Measurement)
  •             Training Exercises (Methods)
  •             Computer / Minitab (Machines)


As with any process we need to identify the key input variables as well as the key output variables.  Ironically often times the training process fails to measure the success or failure of the training itself.  The training process must be evaluated just as projects are and must be continuously evaluated for improvement opportunities.  For example, are there certain exam questions that students often get wrong?  Do recent college graduates have better exam scores and project results than more experienced employees?  These types of questions should be considered during the evaluation of the training process.

First things first.  A key output metric must be established to determine the effectiveness of the training process.  There are numerous books on the market on how to measure the effectiveness of a training process so this article will not expound on this, however the importance of this cannot be overestimated.  A common approach is based on the monetary improvements or ROI that is delivered by the students.   Most likely there is more than one metric in play but the key takeaway is that the common statement “you can’t improve what you can’t measure”.  The same applies to the Training process.

Another metric that should be considered is to measure the student’s test scores to determine if any additional time and attention needs to be given to a given topic.  This too would improve the success of the training process.

The following is a list of key components of the training process, in no particular order.

Training Materials

Physical training materials should be legible, free of grammatical and technical errors.  They should be bound in a usable format that gives the student an easy to use resource.  Use of colors is preferred but if in black and white graphs must be clearly interpreted and easy to understand in the absence of color.

Minitab© is standard software package that is used in most OpEx training.

Trainees

Part of the “The right people” component and a critical factor in the success of the training process.   The key to the selection of the right people is identifying future leaders and those who are technical minded.  The process should foster an environment where the students have the opportunity to apply the learnings from the training and retain the mindset of continuous improvement along with the long-term ability to identify and solve problems.  Successful students typically have a passion to learn and an innate desire to improve processes.   This starts with the hiring process but can also include seasoned employees who have shown the initiative and interest of the process.

A prerequisite is to have a nominal or advance knowledge of computers and associated software such as MSOffice.  The training time will be mostly consumed for the technical topics so very limited time with MSOffice should be allotted.

Trainers

Trainers can make or break the process.  It is imperative that trainers have the background and experience of process improvement and must be able to put themselves in the shoes of the students.  Trainers should have a passion to make the students successful and must make the sessions interesting if not entertaining.

Mentors should also be part of the process to ensure the student’s project are going in the right direction, are technically sound, and must be in alignment with the Trainers and materials.  When possible the mentors and trainers should be the same person.

Machines

Laptop computers should be issued to student with the necessary software, typically Minitab and MSOffice products.

Methods

The methods component can be broken down in 2 sections.  One is the method of training and secondly, the method by which the training process is evaluated.

The method of training should include a significant amount of interaction between students.  The purpose is for the student to understand the tools and how many of the tools require team input.  The trainer should use this opportunity to evaluate the student’s ability to lead and participate in the team dynamic.

The method by which the training process is evaluated would require an evaluation of the testing that is done during the process.  The purpose would be to analyze the test scores data to determine if there are certain topics that students consistently struggle with.  If a deficiency is found the trainer should reevaluate the time and energy given to the given topic or topics.  This is a critical part of treating the training as a process, evaluation of the process, and subsequent improvement.

An FMEA, Failure Modes and Effects Analysis is another OPEX tool that should be utilized in the process.  This tool would identify potential failures of the process and will generate an action plan to address those failures.   Potential failures, such as training room availability, absenteeism, and participant retention through the duration of the training are just a few examples of potential failures.

Mother Nature (Environment)

The training should take place in a location that is conducive to learning.  The environment should be well lit, comfortable, easy to see overhead, and there should be plenty of room for team building activities.  Snacks, food, and drinks should be provided to keep the students energy level high.

Customer

“The right projects” should be determined based on the needs of the customer.  The customer, typically the entity paying for the training, should benefit financially from the training process with and high ROI.

Just as the objective to make projects successful by utilizing the process improvement tools, the training itself should be viewed as a process and open to continuous improvement.

What are some of your tricks that have helped to solve a problem? Join the discussion.

[xyz_lbx_default_code]

Batch tracking simplified

Production problem keep appearing and there isn’t information to fix it? Scott Widener offers a way to use what you already have in hand.

By Scott Widener.

One of the first analyses undertaken in most continuous improvement settings are basic data cuts by readily available characteristics, to see if simple patterns emerge.  As examples: is production worse in the first few hours of start-up, do problems occur at similar rates across all shifts, is there a consistent error, are some days better than others, and so forth. 

Frequently, this sort of simple analysis is quite insightful, because it allows for quick isolation of something to be tracked, and possibly offers a solution.  Under best-case scenarios, the solution may be readily available and this issue is addressed as a matter of course, and is never noted.  However, the deeper and unexplained problems are what typically morph into “the projects”.

One of the disconnects of “the project” is that at most companies; there are experts who know how to do things, if they know what it is that they have to do.  Therein lies the problem that creates “the project”: there isn’t information to guide a solution.

Think of it like sitting at home and the electricity goes out, which is both irritating and inconvenient, but as you sit on the couch in the dark, the question becomes what to do next.  All we know at this stage is that it’s dark, that’s not a good thing because it’s putting a stop to the planned activities. However, what we don’t know is if a main line is down, a thunderstorm interrupted the flow, if a circuit breaker tripped in the panel, etc.  As such, what is the proper solution?  Without information to frame the problem, this remains unknown, and so we continue to live in what is know: sitting in the dark; literally and metaphorically.

In most companies, data is READILY available, but information is not. There are typically thousands upon thousands of pieces of data collected in servers somewhere and file cabinets upon file cabinets of paper documentation, but all of it is data and not actionable information.

One of the ways to fix this situation is to start merging relevant data together, with the help of the internal company experts, to look for “likely sources” of the problem. By knowing which data to seek, between working with internal IT people who understand the structure of the data and have the means to get it, as well as buckling down with the stacks upon stacks of paper records, good data sets can be generated to then allow for the information picture to come together.

However, at this stage a problem occasionally emerges, typically from the paper records.

Electronic records are characteristically generated on an “event basis” in that a record is created each time something occurs: a valve is opened, a photoeye on a case packer is blocked, a gas flow changes, a transaction completes, etc.

However, paper records, generally kept by people, are typically based on some sort of logical grouping, like a batch.

Recently, this problem emerged at a GPS client, wherein multiple batches of material were created in a production system, and the systems were only tracked on paper with limited electronic data capture.

The easiest means to build information is to have a key field, and typically for batched production, this is some form of “lot number” or other production code.  Lot numbers are typically chock-full of information, including the date and location of production, amongst other information.

However, lot numbers are data-entry alphanumeric time-bombs, waiting to explode when they are copied from paper to an electronic format to merge with other data. Given the relatively large number of characters in a lot number, the chances for data-entry errors are reasonably high, and as a key-field, difficult to find.  Therefore, an alternative key field for data aggregation, sorting, filtering and searching is preferred.

Given the limited number of batches per day at this client, coupled with the scope and scale of the batches, it was found that reliable, location-based, time-stamps were quite workable. This also works well with commonly used software, such as Microsoft Excel, which uses a continuous clock as the basis for its date and time formats. This continuous clock, which increments by one for each day (therefore, noon on a given day is at time 0.5), serves as a good means to sort and track batches, as it is unique over a small number of batches, and it is much easier to enter a date and time than it is to type out a lot number of many alphanumeric characters slammed together.

What are some of your tricks that have helped to solve a problem?  Join the discussion.

Creating Enhanced Organizational Capabilities

Guest post by Rob Wardlow.

When seeking to improve the organizational capability for an business it is often helpful to envision the optimal state that the organization is attempting to achieve.

So, in the continuous improvement arena, what does the optimal state look like?  Let’s tackle this from three complimentary avenues: structure, knowledge, and culture.

What should you examine regarding structure for a continuous improvement organization?  I think that most of us would acknowledge that we work in resource constrained environments, and thus, prioritizing the things that will be worked on is of critical concern.  In that regard, then, it is essential that a structural mechanism on identifying and prioritizing improvement opportunities is going to be an essential aspect of an optimal CI organization.  Once CI opportunities are identified, prioritized and ultimately assigned to be addressed, the organization needs some mechanism to address the opportunity.  The spectrum goes from assigning the CI activity to those in the area directly with no support all the way to the other end of the spectrum where the activity is assigned to some entity outside of the area to work the opportunity.  The type of opportunity will dictate the approach taken, but let’s just discuss a few and which approach is likely the best.  First come existing opportunities that have existed for some time.  These probably need to be addressed with outside expertise.  The reason?  If internal folks had the knowledge and expertise to improve the item they most likely would have done so already.  Next comes a situation where something new is going to be created or significant modifications are going to be made.  In this case you likely want those who are conducting the activity to apply some specific tools and techniques so as to prevent problems from creeping into the solution.  Lastly, there is a situation where emotional buy-in of the solution is critical to sustainment of the improvement.  In such a situation having a facilitated approach where the owners of the process are brought along in the journey to the improved state.

I’ve intentionally separated the knowledge component from the structural component.  Many organizations (mostly through the insistence of consultants) equate a certain body of knowledge as requiring a particular organizational structure.  I think that this is backwards.  You first need to understand the structural component and once that is addressed then you can identify the appropriate knowledge component needed to address the need.

What body of knowledge exists in the CI world that addresses identification and prioritization of opportunities?  The best answer is Theory of Constraints, not part of many organizations BOK.  The TOC approach identifies that there is one constraint in a system – and only by addressing the constraint can you truly improve the system.  Next comes LEAN, as it addresses wastes that exist and how to reduce and eliminate them.  One source of waste that may be uncovered is related to quality and productivity of a system.  When excessive variation causes quality and/or productivity issues, these can be best addressed by a DMAIC Six Sigma approach.  And when looking to ensure that problems never enter the system in the first place, then application of a Design for Six Sigma method is appropriate.  Don’t confuse DfSS as merely regular six sigma applied to design, rather it is a methodology that seeks to anticipate and prevent rather than uncover and reduce.

Lastly, but certainly not least, is culture.  Culture is going to be largely driven by the structure and knowledge described above.  In addition to that will be cultural issues like rewards systems, advancement opportunities, etc.  Careful examination of the impacts of these cultural aspects is needed.  As an example, some organizations choose to incentivize improvements by rewarding the close-out of cost saving projects.  This can result in the same “problems” being solved time after time, with no real improvement resulting.  Likewise, a policy of promotion by serving in a CI position can result in rapid turn-over of projects for promotion with little actual improvement.

Envision the structure, knowledge and culture of your ideal CI organization as the first step in bringing it about.

Smart Operational Excellence® Coaches Offer Genuine Interest and Ask the Right Questions

Alex Figueroa

Guest post by Alex Figeroa

As businesses leverage Operational Excellence®, results matter. The huge positive impact that Operational Excellence® efforts can have on business results has been typically measured by translating primary and secondary process metrics to financial results where reduced cost, lower levels of cash to operate a business and enabling more revenue are, generally, the ultimate goals.

There is however, one more dimension of business results that can be attained by disciplined operation, recovering losses and eliminating excess process variation: enhanced individual and organizational capabilities. These critical organizational results might be harder to measure than conventional KPI’s. At the end of the day, Operational Excellence® – through proper coaching and mentorship – can unleash further opportunities for any business to improve continuously through the aligned efforts of knowledgeable, passionate, motivated and talented individuals. And doing so can become a clear enabler to creating more value for current and future customers.
329649_9775Now Operational Excellence® coaching is not so much about teaching and training others, but collaborating with businesses and individuals to reach a better state. A new state that delivers not only better operational results but achieves its goals by building the right structure, creating superior knowledge and promoting the desired culture across the organization. From my vantage point, the best advice Operational Excellence® coaches can give is demonstrating genuine interest on the people they are coaching and asking the right questions.

When Operational Excellence® professionals actively coach others with an open expectation to challenge what is possible, every individual involved – including the coach – reaches a better state. And the approach to coaching might be really simple:

  • What – Expose people to new and relevant tools they were not aware of before and that can be used to solve the operational challenges they are facing.
  • How & When – Coach others to use the tools in the right context, with discipline, to objectively experiment with what they have learned. Regularly provide informal feedback.
  • Who and Why – Operational Excellence tools will be used by individuals who want to learn them beyond rational and analytical reasons, there is always a deeper purpose: a compelling cause, strong beliefs and cultural elements to deal with. Being genuinely interested in the person and asking the right questions facilitates the process of uncovering what this purpose is, how to connect it to the tools being learned and to the improvement work being performed.

While I do not have hard facts as those that can be drawn by a logistic regression or a well designed experiment with conclusive evidence, my experience of over 2 decades coaching and mentoring others tells me that focusing on helping the individuals, as much as or even more than improving a process itself, leads to better and sustainable business and organizational results.

What is your experience coaching others?

[xyz_lbx_default_code]

How To Avoid The Evils Within Customer Satisfaction Surveys

Guest Post by Rob Brogle, Global Productivity Solutions. Originally posted on iSixSigma October 24, 2013

I.  Introduction

 Ever since the Ritz-Carlton Hotel Company won the Malcolm Baldrige National Quality Award for the second time in 1999, companies across many different industries began trying to follow their lead in attempting to achieve the same level of outstanding customer satisfaction.  This was a good thing, of course, as CEOs and executives began incorporating customer satisfaction into their company goals and communicating frequently to their managers and employees about the importance of making customers happy.

When Six Sigma and other metrics-based systems began to spread through these companies, it became apparent that customer satisfaction needed to be measured using the same type of data-driven rigor that other performance metrics (processing time, defect levels, financials, etc.) were utilizing.  After all, if customer satisfaction was to be put at the forefront of a company’s improvement efforts, then a sound means of measuring this quality would be required.

Enter the customer satisfaction survey.  What better way to measure customer satisfaction than asking the customers themselves?  Companies immediately jumped on the survey bandwagon—using mail surveys, automated phone surveys, e-mail, web-based, and many other platforms.  Point systems were used (ratings on a 1-10 scale, 1-5 scale, etc.) that produced numerical data and allowed for a host of quantitative analyses.  Use of “Net Promoter Score” (NPS) to gauge customer loyalty became a goldmine for consultants selling these NPS services.  Customer satisfaction could be broken down by business unit, department, and individual employee.  Satisfaction levels could be monitored over time to determine upward or downward trends; mathematical comparisons could be made between customer segments, product or service types.  This was a CEO’s dream—and it seemed there was no limit to the customer-produced information that could help transform a company into the “Ritz-Carlton” of its industry.

In reality, there was no limit to the misunderstanding, abuse, wrong interpretations, wasted resources, poor management, and employee dissatisfaction that would result from these surveys.  Although there were some companies that were savvy enough to understand and properly interpret their survey results, the majority of companies did not.  And this remains the case today.

What could possibly go wrong with the use of customer satisfaction surveys?  After all, surveys are pretty straightforward tools that have likely been used since the times of the Egyptians (Pharaoh satisfaction levels with pyramid quality, etc.).  The reality is that survey data has a lot of potential issues and limitations that makes it different from other “hard” data that companies utilize.  It is critical to recognize these issues when interpreting survey results—otherwise what seemed like a great source of information can cause a company to inadvertently do many bad things.  Understanding and avoiding these pitfalls will be the focus of this commentary.

II.  Survey Biases and Limitations

Customer satisfaction surveys are everywhere; in fact, we tend to be bombarded with e-mail or online survey offers from companies who want to know our opinions about their products, services, etc.  In the web-based world of today, results from these electronic surveys can be immediately stored in databases and analyzed in a thousand different ways.  However, in virtually all cases the results are wrought with limitations and flaws.  We will now discuss some of the most common survey problems which include various types of biases, variations in customer interpretations of scales, and lack of statistical significance.  These are the issues that must be taken into account if sound conclusions are to be drawn from survey results.

A.   Non-response Bias

 Have you ever called up your credit card company or bank and were asked to stay on the line after your call is complete in order to take a customer satisfaction survey?  How many times do you actually stay on the line to take that survey?  If you’re like the vast majority of people, you hang up as soon as the call is complete and get on with your life.  But what if the service that you got on that phone call was terrible, the agent was rude, and you were very frustrated and angry at the end of the call.  Then would you stay on the line for the survey?  Chances are certainly higher that you would.  And that is a perfect example of the non-response bias at work.

Although surveys are typically offered to a random sample of customers, the recipient’s decision whether or not to respond to the survey is not random.  Once a survey response rate dips below 80% or so, the inherent non-response bias will begin to affect the results.  The lower the response rate, the greater the non-response bias.  The reason for this is fairly obvious:  the group of people who choose to answer a survey is not necessarily representative of the customer population as a whole.  The survey responders are more motivated to take the time to answer the survey than the non-responders; therefore, this group tends to contain a higher proportion of people who have had either very good, or more often, very bad experiences.  Changes in response rates will have a significant effect on the survey results.  Typically, lower response rates will produce more negative results, even if there is no actual change in the satisfaction level of the population.

 B.   Survey Methodology Bias

 The manner in which a customer satisfaction survey is administered can also have a strong impact on the results.  Surveys that are administered in person or by phone tend to result in higher scores than identical surveys distributed by e-mail, snail mail, or on the web.  This is due to people’s natural social tendency to be more positive when there is another person directly receiving feedback (even if the recipient is an independent surveyor).  Most of us don’t like to give people direct criticism, so we tend to go easy on them (or the company they represent) when speaking with them in person or by phone.  E-mail or mail surveys have no direct human recipient and therefore the survey taker often feels more freedom to give negative feedback—they’re much more likely to let the criticisms fly.

Also, the manner in which a question is asked can have a significant impact in the results.  Small changes in wording can affect the apparent tone of a question, which in turn can impact the responses and the overall results.  For example, asking “How successful were we at fulfilling your service needs” may produce a different result than “How would you rate our service?”  Even the process by which a survey is presented to the recipient can alter the results—surveys that are offered as a means of improving products or services to the customer by a “caring” company will yield different outcomes than surveys administered solely as data collection exercises or surveys given out with no explanation at all.

C.   Regional Biases

Another well-known source of bias that exists within many survey results is regional bias.  People from different geographical regions, states, countries, urban vs. suburban or rural locations, etc. tend to show systematic differences in their interpretations of point scales and their tendencies to give higher or lower scores.  Corporations that have business units across diverse locations have historically misinterpreted their survey results this way.  They will assume that a lower score from one business unit indicates lesser performance, when in fact that score may simply reflect a regional bias compared to the locations of other business units.

D.   Variation in Customer Interpretation and Repeatability of the Rating Scale

Imagine that your job is to measure the length of each identical widget that your company produces to make sure that the quality and consistency of your product is satisfactory.  But instead of having a single calibrated ruler with which to make all measurements, you must make each measurement with a different ruler.  No problem if all the rulers are identical, but now you notice that each ruler has its own calibration.  What measures as one inch for one ruler measures 1¼ inches for another ruler, ¾ of an inch for a third ruler, etc.  How well could you evaluate the consistency of the widget lengths with that kind of measurement system if you need to determine lengths to the nearest 1/16 of an inch?  Welcome to the world of customer satisfaction surveys.

Unlike the scale of a ruler or other instrument which remains constant for all measurements (assuming its calibration remains intact), the interpretation of a survey rating scale varies for each responder.  In other words, each person who completes the survey has his or her own personal “calibration” for the scale.  Some people tend to be more positive in their assessments; other people are inherently more negative.  On a scale of 1-10, the same level of satisfaction might solicit a 10 from one person but only a 7 or 8 from another.

In addition, most surveys exhibit poor repeatability.  When survey recipients are given the exact same survey questions multiple times, there are often differences in their responses.  Surveys rarely pass a basic gauge R&R (repeatability and reproducibility) assessment.  Because of these factors, surveys should be considered very noisy (and biased) measurement systems, and therefore their results cannot be interpreted with the same precision and discernment as data that is produced by a physical measurement gauge.

E.   Statistical Significance

 Surveys are, by their very nature, a statistical undertaking and therefore it is essential to take the statistical sampling error into account when interpreting survey data.  As we know from our Six Sigma backgrounds, sample size is part of the calculation for this sampling error:  if a survey result shows a 50% satisfaction rating, does that represent 2 positive responses out of 4 surveys or 500 positives out of 1000 surveys?  Clearly our margin of error will be much different for those two cases.

There are undoubtedly thousands of case studies of companies who completely fail to take margin of error into account when interpreting survey results.  A well-known financial institution would routinely punish or reward their call center personnel based on monthly survey results—a 2% drop in customer satisfaction would solicit calls from execs to their managers demanding to know why the performance level of their call center was decreasing.  Never mind that the results were calculated from 40 survey results with a corresponding margin of error of ±13%, making the 2% drop completely statistically meaningless.

Another well-known optical company set up quarterly employee performance bonuses based on individual customer satisfaction scores.  By achieving an average score between 4.5 and 4.6 (based on a 1-5 scale), an employee would get a minimum bonus, if they achieved an average score between 4.6 and 4.7 they would get an additional bonus, and if their average score was above 4.7 they would attain their maximum possible bonus.  As it turned out, each employee’s score was calculated from the average of less than 15 surveys—the margin of error for those average scores was ±0.5.  Therefore, all of the employees had average scores within this margin of error and thus there was no distinguishability at all between any of the employees.  Differences of 0.1 points were purely statistical “noise” with no basis in actual performance levels.

Essentially, when companies fail to take margin of error into account, they wind up making decisions, rewarding or punishing people, taking actions, etc. based purely on random chance.  And as our friend W. Edwards Deming told us 50 years ago, one of the fastest ways to completely de-motivate people and create an intolerable work environment is to evaluate people based on things that are out of their control.

III.  Proper Use of Surveys

 So what can be done?  Is there a way to extract useful information about surveys without misusing them?  Or should we abandon the idea of using customer satisfaction surveys as a means of measuring our performance?

Certainly, it is better not to use surveys at all then to misuse and misinterpret them.  The harm that can be done when biases and margin of error are not understood is worse than the “benefit” of having misleading information.  However, if the information from surveys can be properly understood and interpreted within their limitations then surveys can, in fact, help to guide companies in making their customers happy.  Here are some ways that can be accomplished.

A.   Use Surveys to Determine the Drivers of Customer Satisfaction, Then Measure Those Drivers Instead

 Customers generally aren’t pleased or displeased with companies by chance—there are key drivers that influence their level of satisfaction.  Use surveys to determine what those key drivers are and then put performance metrics on those drivers, not on the survey results themselves.  Ask customers for the reasons why they are satisfied or dissatisfied, then affinitize those responses and put them on a Pareto chart.  This information will be much more valuable than a satisfaction score, as it will identify root causes of customer happiness or unhappiness on which you can then develop measurements and metrics.

For example, if you can establish that responsiveness is a key driver in customer satisfaction then start measuring the time between when a customer contacts your company and when your company gives a response.  That is a “hard” measurement—much more reliable than a satisfaction score.  The more that a company focuses on improving the metrics that are important to the customer (the customer CTQs), the more that company will improve real customer satisfaction (which is not always reflected in biased and small-sample survey results).

B.   Improve Your Response Rate

 If you want your survey results to reflect the general customer population (and not a biased subset of customers) then you must have a high response rate to minimize the non-response bias.  Again, the goal should be at least 80% response rate.  One way to achieve this is to send out fewer surveys but send them to a targeted group that you’ve reached out to ahead of time.  Incentives for completing the survey along with reminder follow-ups can help increase the response rate significantly.

Also, making the surveys short, fast, and painless to complete can go a long way in improving response rates.  As tempting as it may be to ask numerous and detailed questions to squeeze every ounce of information possible out of the customer, you are likely to have a lot of survey abandonment in those cases once people realize it’s going to take them more than a couple of minutes to complete.  You are much better off giving a concise survey that is very quick and easy for the customers to finish.  Ask a few key questions and let your customers get on with their lives—they will reward you with a higher response rate.

C.    Don’t Try To Make Comparisons Where There Are Biases Present

A lot of companies use customer survey results to try to score and compare their employees, business units, departments, etc.  These types of comparisons must be taken with a large block of salt, as there are too many potential biases that can produce erroneous results.  Do not try to compare across geographic regions (especially across different countries for international companies), as the geographic bias could cause you to draw the wrong conclusions.  If you have a national or international company and wish to sample across your entire customer base, be sure to use stratified random sampling so that your customers are sampled in the same geographic proportion that is representative of your general customer population.

Also, do not compare results from surveys that were administered differently (phone vs. mail, e-mail, etc.) even if the survey questions were identical.  The survey methodology can have a significant influence on the results.  Be sure that the surveys are all identical, and are administered to the customers using the exact same process.

And, finally, always keep in mind that surveys rarely are capable of passing a basic gauge R&R study.  They represent a measurement system that is extremely noisy and flawed, and therefore using survey results to make fine discernments is usually not possible.

D.    Always, Always, Always Account for Statistical Significance in Survey Results

This is the root of the majority of survey abuse—where management makes decisions based on random chance rather than on significant results.  In these situations our Six Sigma tools can be a huge asset, as it’s critical to educate management on the importance of proper statistical interpretation of survey results (as with any type of data).

Set the strict rule that no survey result can be presented without including the corresponding margin of error (i.e., the 95% confidence intervals).  For survey results based on average scores, the margin of error will be roughly ± where s  is the standard deviation of the scores and n is the sample size (for sample sizes < 30, the more precise t-distribution formula should be used instead).  If the survey results are based on percentages rather than average scores, then the margin of error can be approximated as  where p is the resulting overall proportion and again n is the sample size (note that the Clopper-Pearson exact formula should be used if np < 5 or (1-np) < 5).  Mandating that margin of error be included with all survey results will help frame the results for management, and will go a long way in getting people to understand the distinction between significant differences and random sampling variation.

Also, be sure to use proper hypothesis testing when making survey result comparisons between groups.  All our favorite tools should be utilized:  for comparing average or median scores we have the T-tests, ANOVA, or Mood’s Median tests (among others); for results based on percentages or counts we have our proportions tests or chi-squared analysis.

If we are comparing a large number of groups or are looking for trends that may be occurring over time, the data should be placed on the appropriate control chart.  Average scores should be displayed on an  and R or  and S chart, while scores based on percentages should be shown on a P chart.  For surveys with large sample sizes, an I and MR chart may be more appropriate (a la Donald Wheeler) to account for variations in the survey process that are not purely statistical (such as biases changing from sample to sample which is very common). Control charts will go a long way in preventing management overreaction to differences or changes that are statistically insignificant.

And finally, make sure that if there are goals or targets being set based on customer satisfaction scores, those target levels must be statistically distinguishable based on margin of error.  Otherwise, people get rewarded or punished based purely on chance.  In general, it is always better to set goals based on the drivers of customer satisfaction (“hard” metrics) rather than on satisfaction scores themselves, but in any case the goals must be set to be statistically significantly different from the current level of performance.

IV.  Conclusion

 Customer satisfaction surveys are bad, evil things.  Okay, that’s not necessarily true but surveys do have a number of pitfalls that can lead to bad decisions, wasted resources, and unnecessary angst at a company.  The key is to understand survey limitations and to not treat survey data as if it were precise numerical information coming from a sound, calibrated measurement device.  The best application of customer surveys is to use them to obtain the drivers of customer happiness or unhappiness, then create the corresponding metrics and track those drivers instead of survey scores.  Create simple surveys and strive for high response rates to assure that the customer population is being represented appropriately.  Do not use surveys to make comparisons where potential biases may lie, and be sure to include margin of error and proper statistical tools in any analysis of results.

Used properly, customer satisfaction surveys can be valuable tools in helping companies understand their strengths and weaknesses, and in helping to point out areas of emphasis and focus in order to make customers happier.  Used improperly, and many bad things happen.  Make sure your company follows the right path.

[xyz_lbx_default_code]

How many teeth does an ox have?


An old friend and one of my greatest teachers, Jim Blanden, told a story of how the Greek philosophers sat around debating how many teeth an ox had.  What should be obvious is to get off of your butt and go look in a few mouths and stop talking about something you have no data on.


I saw a great parallel to this at Honda of America over two decades ago. They have several simple practices to facilitate problem solving. Quite simply they start meetings asking for a show of hands of who has seen the problem to be discussed. Those that don’t raise their hand are excused and cannot participate.


Wow. Think of the hours, days, weeks, years that could have been saved during your career if people understood opinions don’t make any difference, data does.


Yet there are several instances of just that any time we touch most organizations.


The one that has me most intrigued is one going on with a long time customer of ours. It is an organization, which has been bought and sold multiple times in the past few decades and stripped of resources each time, but in spite of all that still has a few dozen of the most prominent name brands in the world. But their market share continues to erode, mainly being attacked by store brands and generics where the price difference doesn’t fit the price elasticity model of a lot of consumers. Clearly they need to be more efficient in the value stream to the customer and they need to strip away excesses in their corporate structure.


Their version of “ox teeth” is sigma level. There is a raging ongoing debate if there is value in further improving their capability. This is being debated from the boardroom to the factory floor while the people charged with continuing improvement are getting trapped into the mindset that went away while we helped them improve output by greater than 25% (and saw an additional 4% profit while doing so). The trained resources are gradually shifting to other pursuits, mostly outside the company.


What should they do? What any rational businessperson should know to do instinctively – go quantify the opportunity and make a decision based on ROI. And not just in the value streams serving the customer, but in SIOP and R&D and Purchasing and …


Just a hint, you don’t find those answers in the Balance Sheets or any of the reporting to Wall Street but they are discoverable and quantifiable if you know what you are doing.


If you don’t know how, call me.


Gary

(313) 506 1594

[xyz_lbx_default_code]

The 10/90 Challenge


You’ve heard all the reasons. Probably many even came from you.

You’re being asked by the C-suite or your Private Equity partner to make improvements that you don’t know how to do as rapidly or to the depth you are being asked to. Your process owners tell you all of their processes are “optimized” (whatever that means!). Your culture isn’t right for or your organization thinks you have already checked the box for ___________ (lean, six sigma, OPEX, TPM,… Fill in the blank). You are asked for aggressive results but aren’t given the means to do it.  And the list goes on.

The list is long and unless you are one of those rare handful of companies that is the market leader / low cost producer in your business segment, you are dead wrong.

Even though I came out of one of the best learning environments of this generation – Motorola then AlliedSignal then GE – I’ve never been tied to labels like Lean, Six Sigma, TPM,  or Shainin. To think that a prescribed method implemented to a template is all you will ever need is insane. We started running into companies a decade ago that were looking for the next magic bullet and would start every conversation with something like “we’ve implemented Lean and Six Sigma and we’re looking to move to the next level”. We started countering them with no you haven’t which was not very effective. We then learned to ask them if  we could see the operation that was having the greatest difficulty and then show them how to significantly improve the operation with a payback on the investment of at least 3 to 1 in the following 12 months. It’s usually greater than 10 to 1.

We’ve labeled the idea the 10/90 challenge. This is how it works.

1)   In ten days or less, we will identify specifically what can be done in the following 90 days that will give demonstratively better results that will impact safety, output, or customer satisfaction. Of course we ask for complete transparency – access to financials, data, process, people, and systems. We will take on any process wherever it lies in the order to delivery cycle including any and all planning processes.

2)   In the following 90 days, we put a team of two into the process and make significant gains – enough to at least give the 3 to 1 return. Of course we insist on complete cooperation of all stakeholders including access to key stakeholders for a few hours a week away from their work and reviews on a regular cycle (weekly locally, monthly with Leadership).

3)   We then have a discussion of the return for working the entire system.

The truth is there are no silver bullets. Teaching popular methods alone doesn’t mean squat. Having leadership in favor of change doesn’t mean squat. Hiring someone from GE, P&G, or __________ (fill in the blank of the latest company that has a rock star CEO) doesn’t mean squat.

If you want to know what does mean squat, call me.

Gary

(586) 412-9609 office

[xyz_lbx_default_code]